•
1 min read
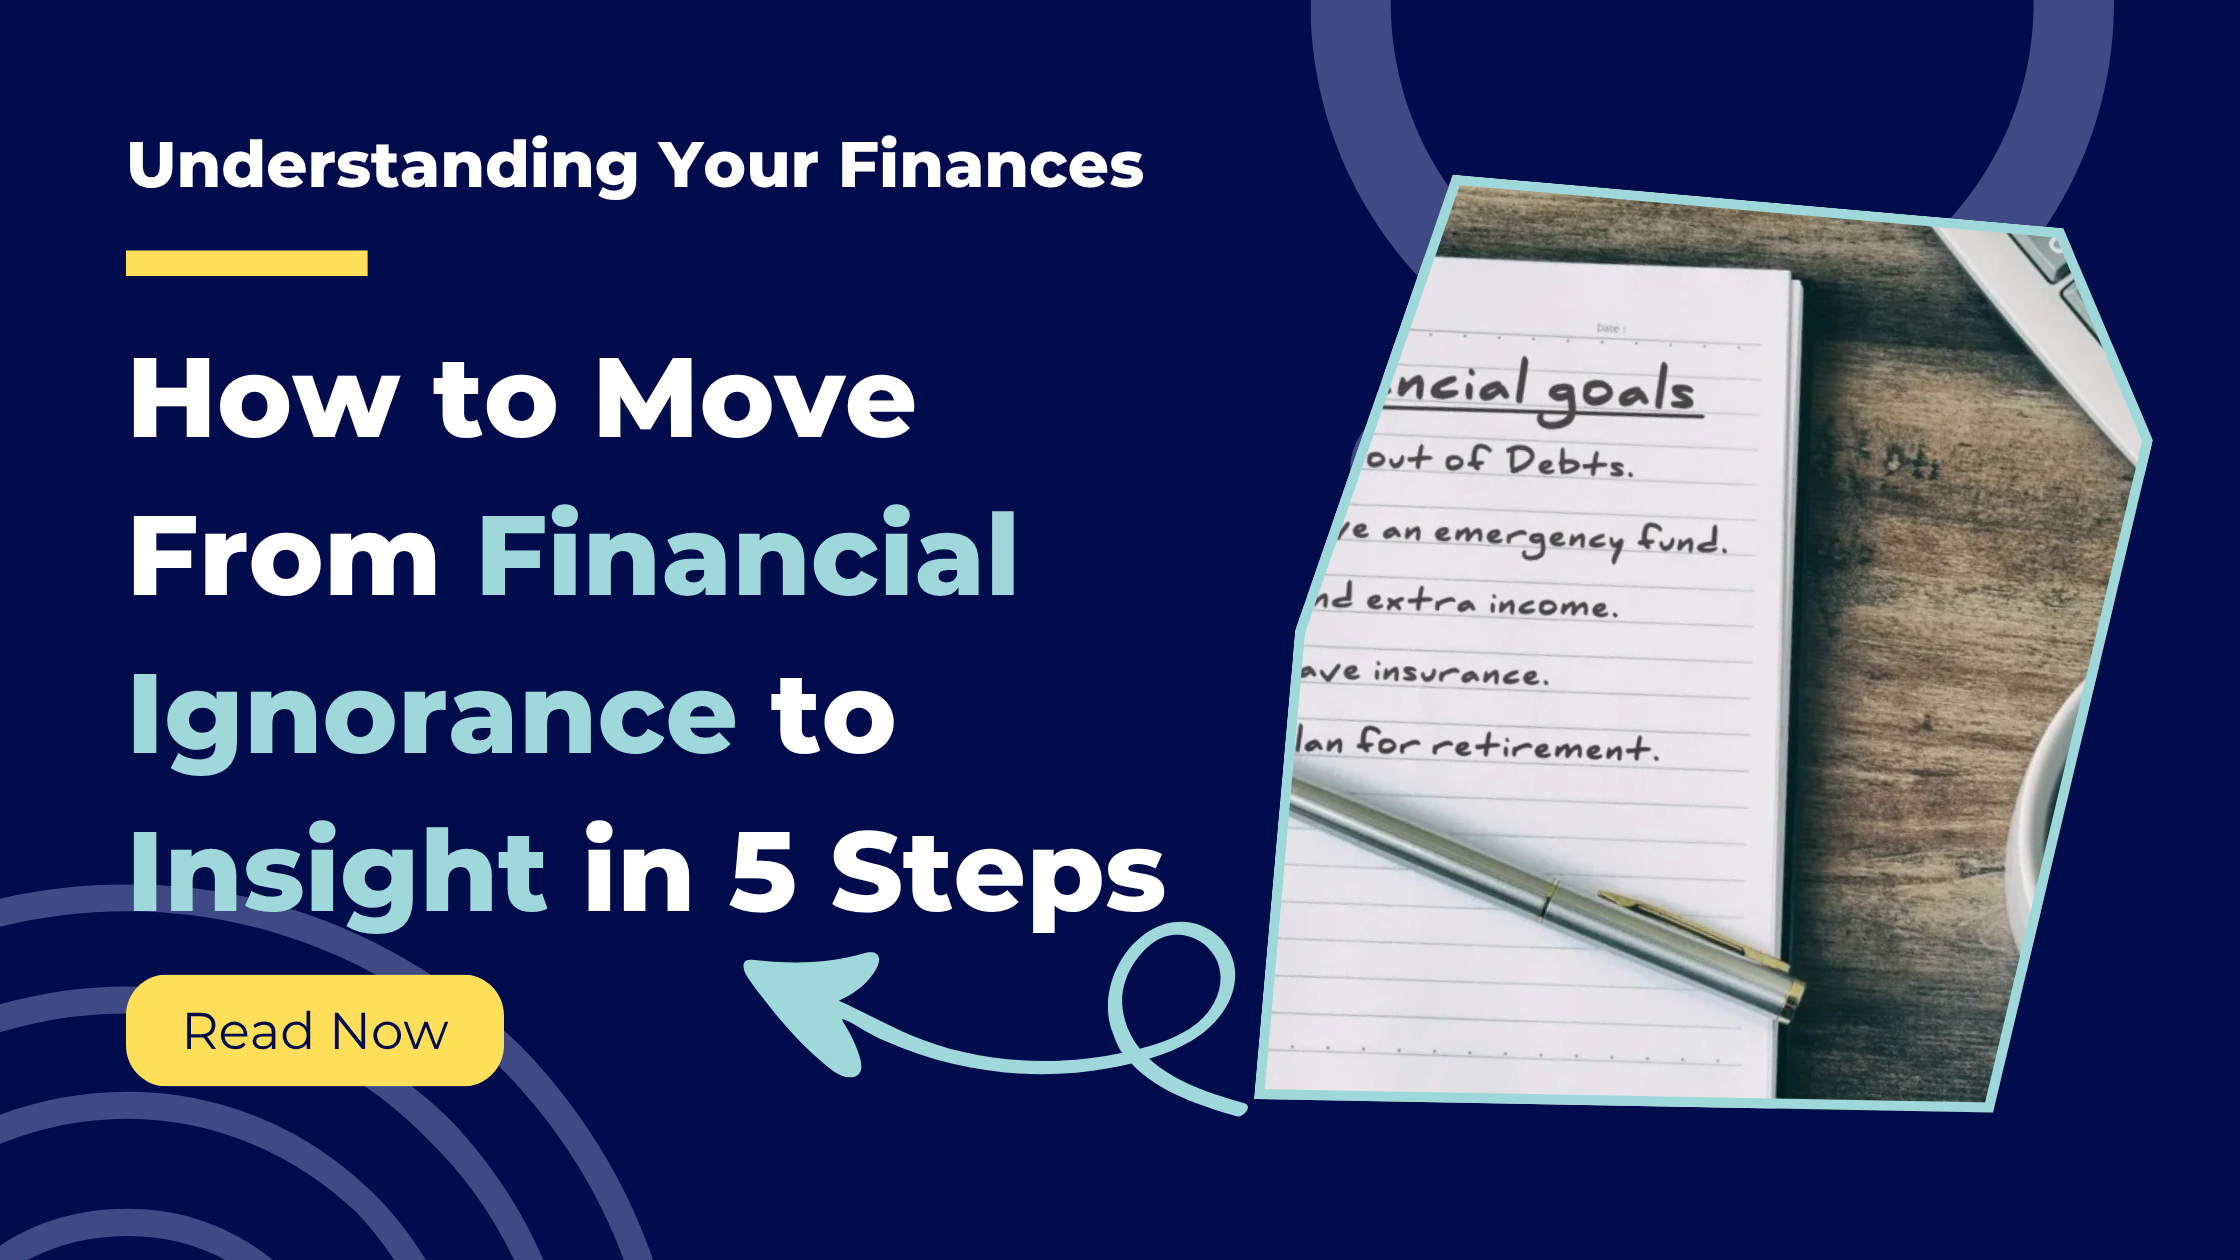
How to Move From Financial Ignorance to Insight in 5 Steps
A practical framework for transforming financial blind spots into actionable knowledge that drives real progress with your money.
In our previous post, we established that financial ignorance prevents progress. You cannot change what you do not know. Awareness beats willpower. Knowledge transforms behaviour.
But knowing that awareness matters is not the same as building awareness. Where do you start? What does the process actually look like? How do you move from "I have no idea what I spend" to "I understand my financial patterns and can make informed decisions"?
This post answers those questions. You will learn the five-step framework for transforming financial ignorance into actionable insight. This is not about obsessive tracking or guilt-driven penny-pinching. It is about building enough visibility to make confident decisions instead of anxious guesses.
Each step builds on the previous one. Skip a step and the framework weakens. Follow them in order and you create sustainable financial awareness that actually changes behaviour.
Step 1: Stop Guessing, Start Tracking
What This Step Achieves
You establish the foundation. You move from perception to reality. You replace guesses with data. This is the most important step. Without accurate data, everything that follows is built on sand.
Why Most People Skip This (And Why That Fails)
Most people try to improve their finances without tracking first. They set goals based on vague impressions. "I spend too much on takeaway" becomes a resolution without any baseline measurement.
Three months later, they have no idea if they improved. They think they did better. Maybe. But thinking is not knowing. Without data, there is no accountability. Without accountability, change does not stick.
How to Actually Do This
Connect all your financial accounts to one platform. This means current accounts, savings, credit cards, loans. Everything money flows through. Partial visibility creates partial understanding.
Use secure open banking connections. Not manual CSV exports. Not memory. Not receipts in a shoebox. Automatic sync from your bank to your tracking system.
Let the system capture transactions automatically. No manual entry. Manual entry fails because life gets busy. You forget. You fall behind. The system breaks. Automatic sync removes the discipline requirement.
Give it time to build history. One week of data shows very little. One month shows more. Three months reveals patterns. The longer the history, the clearer the picture.
What Success Looks Like
You open your dashboard. You see every transaction from every account in one place. You did nothing beyond the initial setup. The system did the work. You now have comprehensive data about what is actually happening with your money.
This is not the finish line. This is the starting line. But you are finally on the track instead of wandering in the car park.
Fiscility handles this step completely. Connect accounts once via secure open banking. Transactions sync automatically from all linked accounts. Comprehensive data captured with zero ongoing effort.
Step 2: Review Your Data Regularly
What This Step Achieves
You build financial intuition. You develop a sense for what normal looks like. This lets you spot anomalies immediately instead of months later. Regular review transforms raw data into working knowledge.
Why This Step Gets Skipped
People think tracking is enough. It is not. Data sitting unreviewed might as well not exist. You need to actually look at what the system is capturing. Otherwise you are just collecting information, not using it.
The other reason people skip this: they do not know what to look for. They open their dashboard. They see numbers. They feel overwhelmed. They close it. Nothing learned.
How to Actually Do This
Schedule a weekly money review. Pick a specific day and time. Sunday morning. Friday afternoon. Wednesday evening. Whatever works. Make it recurring. Treat it like any other appointment.
Fifteen to twenty minutes. No more. You are not doing your taxes. You are reviewing one week of activity.
Ask four simple questions during each review:
What did I spend this week? Total number. Not categories yet. Just the overall spending for seven days.
Does this number feel high, low, or normal? Trust your gut. If £340 feels high, note that. If £180 feels surprisingly low, note that. Your instinct will calibrate over time.
Are there any transactions I don't recognise? Mystery charges. Subscriptions you forgot about. Duplicate charges. Fraud. These appear in weekly reviews. They hide in monthly reviews because too much time has passed.
Where did the money go? Now look at categories. Food, transport, entertainment, bills. Where did the £340 actually go? No judgement. Just observation.
What Success Looks Like
After four weeks of regular review, you know your rhythm. You know that £250-£300 is typical for you. You know Tuesday is usually low. Saturday is usually high. You know which transactions are normal and which are unusual.
When an anomaly appears, you catch it immediately. A £47 charge you do not recognise. A spike in food spending. These things stand out because you know what normal looks like.
Fiscility makes weekly review effortless. Weekly reports arrive automatically every Sunday (or whatever day you choose) summarising the past seven days. Total spending. Category breakdown. Notable transactions. Everything you need for a complete review in one email.
Step 3: Discover Patterns and Insights
What This Step Achieves
You move from observation to understanding. You see not just what happened, but why it happened and when it tends to happen. This is where data becomes insight. Insight is what drives change.
Why This Is Where Most People Stop
Steps 1 and 2 are mechanical. Connect accounts. Review weekly. Straightforward. Step 3 requires curiosity and investigation. You have to look deeper. Most people do not know what to investigate or how.
They see the data. They do not see the patterns within the data. So they stay at surface level. "I spent £340 this week." That is observation. It is not insight.
How to Actually Do This
Explore spending by day of week. Which days consistently cost more? Most people discover Friday and Saturday are expensive. But some discover Tuesday is their problem day because they shop after work when hungry.
Look at your last three months. Calculate average spending per day of the week. Monday through Sunday. The pattern will surprise you.
Investigate time-of-day patterns. When do unplanned purchases happen? For many people, it is after 8 PM. Tired. Defences down. Order takeaway. Buy things online. Uber home instead of taking the bus.
If your tracking system shows transaction timestamps, look for clusters. When is your willpower weakest?
Find your spending hotspots during the month. Do you spend evenly across the month or in bursts? Many people discover they spend heavily in the first week after payday, then struggle the last week.
Look at spending by week of the month. Week 1 (days 1-7), Week 2 (days 8-14), Week 3, Week 4. Is it even? Or do you have a pattern?
Identify category surprises. You thought food was your biggest category. Actually, transport is 30% of spending and food is 18%. This insight redirects your optimisation efforts entirely.
Look at your top five categories by percentage of total spending. Does reality match your perception?
Spot irregular expenses hiding in plain sight. Subscriptions you forgot. Annual renewals that hit once and disappear for 11 months. These hide in the noise. Look specifically for low-frequency transactions that add up.
Filter your transactions by merchant. Sort by frequency. Things that appear once or twice are worth investigating.
What Success Looks Like
You close your dashboard with at least three insights you did not have before. "Thursdays cost me £30 more than other days because I do the weekly shop hungry after work." "I spend £180 monthly on subscriptions I barely use." "My spending spikes to £600 the first week after payday."
These are insights. They point to specific actions. They give you something to work with.
Fiscility's analytics dashboard makes pattern discovery visual. Spending by day of week shown in charts. Category breakdowns with percentages. Monthly trends over time. Recurring expense identification. All the patterns visible without manual analysis.
Step 4: Use Insights to Set Specific Goals
What This Step Achieves
You translate insights into action. Vague goals fail. Specific goals succeed. This step turns "I should spend less" into "I will reduce Thursday spending from £90 to £60 by doing the weekly shop on Sunday morning instead."
Why Vague Goals Fail
"Spend less." "Save more." "Be more careful." These goals have no measurable target. No specific action. No timeline. They are wishes, not goals.
Three months later, did you achieve them? You have no idea. There was nothing to achieve. Just a general sense that you should try harder.
Specific goals have numbers and actions. You can measure them. You know if you succeeded or failed. Success reinforces behaviour. Measurable progress creates momentum.
How to Actually Do This
Pick one insight from Step 3. Do not try to fix everything. Pick the insight with the most leverage. The one where a small change creates big impact.
Example insights that suggest specific goals:
- "I spend £180 monthly on subscriptions" → Cancel unused subscriptions
- "Thursday costs £30 more because I shop hungry" → Shop Sunday instead
- "I spend £80 every Friday after work" → Plan Friday activities in advance
- "Week 1 spending is £600, weeks 2-4 average £450" → Spread payday spending across the month
Turn the insight into a SMART goal. Specific, Measurable, Achievable, Relevant, Time-bound.
Vague: "Spend less on subscriptions."
Specific: "Cancel Spotify, Adobe Creative Cloud, and Netflix Premium by Friday. Downgrade to Spotify Duo and Netflix Standard. Reduce monthly subscription spend from £180 to £95 starting next month."
Vague: "Stop spending so much on Thursdays."
Specific: "Move weekly shop to Sunday morning. Pack lunches Thursday. Reduce Thursday spending from £90 to £60 over the next four weeks."
Write down the expected impact. If you achieve this goal, what changes? This creates accountability and motivation.
"Cancelling three subscriptions saves £85 monthly or £1,020 annually."
"Reducing Thursday spending by £30 saves £120 monthly or £1,440 annually."
These numbers matter. They make the effort feel worth it.
What Success Looks Like
You have a written goal with a specific number, a specific action, and a specific timeline. You know exactly what success looks like. You can check in four weeks and definitively say whether you achieved it.
Fiscility helps identify high-impact goals. The analytics dashboard highlights your highest spending categories, most expensive days, and recurring costs. The insights are visible. You just pick which one to address first.
Step 5: Track Progress Against Baseline
What This Step Achieves
You close the loop. You measure whether your actions worked. This creates learning and momentum. Small wins motivate continued effort. Small failures reveal what to adjust.
Why People Skip This Step
They set a goal. They try. They forget about it. A month later, they wonder if anything changed. They have no idea because they did not track progress against the baseline.
Without comparison, you do not know if you improved. You might feel like you did better. Feelings are not data. Data is data.
How to Actually Do This
Record your baseline before you start. If you want to reduce Thursday spending, write down what Thursday currently costs. Average over four weeks. That is your baseline.
Example: Thursdays currently average £90. That is the baseline.
Check progress weekly. Every Thursday for the next four weeks, record what you spent. Compare to the baseline.
Week 1: £85 (down £5)
Week 2: £65 (down £25)
Week 3: £88 (down £2)
Week 4: £62 (down £28)
New average: £75. Goal was £60. You are not there yet, but you reduced spending by £15 per Thursday or £60 monthly. Measurable progress.
Analyse what worked and what did not. Week 2 and Week 4 were strong. What was different? You shopped on Sunday. Week 3 was weak. What happened? You skipped Sunday shopping, ended up at Tesco on Thursday evening.
This tells you the intervention works when you execute it. The problem is consistency, not the strategy itself.
Adjust based on learnings. If the intervention is working but you are not hitting the goal, intensify it. If it is not working at all, try a different approach.
If Sunday shopping reduces Thursday spending but not enough, add packing lunches. If it is not working at all, maybe Thursday is not the problem. Maybe the real issue is something else revealed in Step 3.
What Success Looks Like
Four weeks after setting your goal, you open your dashboard. You compare this month to last month. You see measurable improvement. Thursday spending decreased 17%. Monthly spending decreased £60. You achieved 75% of your goal.
You now have proof that insight leads to action and action leads to results. This proof is what sustains long-term behaviour change.
Fiscility tracks progress automatically. Compare this week to last week. This month to last month. This quarter to last quarter. Trends show improvement or decline immediately. You see if your efforts are working without manual calculations.
Why This Framework Works
It Builds Progressively
Each step depends on the previous one. You cannot discover patterns without data. You cannot set specific goals without insights. You cannot track progress without baselines. The framework compounds.
It Requires Minimal Willpower
The only moment requiring effort is Step 1 setup. After that, the system does most of the work. Transactions sync automatically. Reports arrive automatically. You review for fifteen minutes weekly. That is sustainable.
It Creates Feedback Loops
Step 5 feeds back into Step 3. You tracked progress. You learned what works. That becomes new insight. New insight leads to new goals. The cycle continues. Progress compounds.
It Transforms Anxiety Into Action
When you operate blind, money creates anxiety. You feel uncertain. You guess. You worry. When you follow this framework, uncertainty becomes information. Information becomes action. Action creates results. Results create confidence.
How Fiscility Accelerates Every Step
Fiscility was built to make this framework effortless.
Step 1: Connect accounts once via secure open banking. All transactions sync automatically. Comprehensive data with zero effort.
Step 2: Weekly reports arrive every Sunday (or your chosen day) with complete summaries. Total spending. Category breakdown. Notable transactions. Review in five minutes.
Step 3: Analytics dashboard visualises patterns. Spending by day of week. Category percentages. Monthly trends. Recurring expense identification. Patterns visible without analysis.
Step 4: Insights from the dashboard point to high-leverage goals. Highest spending categories. Most expensive days. Forgotten subscriptions. Clear targets.
Step 5: Historical comparison built in. This week versus last week. This month versus last month. Progress visible automatically.
The framework works without Fiscility. But Fiscility removes the friction that causes most people to quit.
Key Takeaways
Moving from financial ignorance to insight requires five steps: track everything automatically, review weekly, discover patterns, set specific goals, and track progress.
Each step builds on the previous one. Skip a step and the framework weakens. Follow them in order and you create sustainable awareness.
The framework requires minimal ongoing effort once set up. Automation does the heavy lifting. You just review and act on insights.
Progress tracking creates momentum. Small wins compound. Measurable improvement motivates continued effort.
Fiscility automates every step. Tracking, reporting, pattern discovery, and progress measurement happen without manual work.
Start Building Financial Insight Today
You now have the framework. Five steps from ignorance to insight. From guessing to knowing. From anxiety to confidence.
The question is not whether this works. The question is whether you will implement it.
Fiscility makes implementation effortless. Connect your accounts. Let the system do the work. Follow the framework. Watch progress compound.
Try Fiscility free for 7 days and start transforming financial ignorance into actionable insight: Start Your Free Trial
Summary
Financial awareness is built through five progressive steps: automatic tracking, regular review, pattern discovery, specific goal-setting, and progress measurement.
Each step depends on the previous one. Together they transform raw data into actionable insight that drives real behaviour change.
The framework requires minimal ongoing effort. Automation removes the friction that causes most tracking systems to fail.
Fiscility delivers every step automatically through connected accounts, scheduled reports, analytics dashboards, and historical comparison tools.
Found this helpful? Share it with others!

Ready to take control of your finances?
Join Fiscility today and start your financial journey.
Apply for a Membership