Analytics Dashboard
Comprehensive visual analytics with five specialized dashboard views, each designed for specific financial analysis needs using interactive Recharts visualizations.
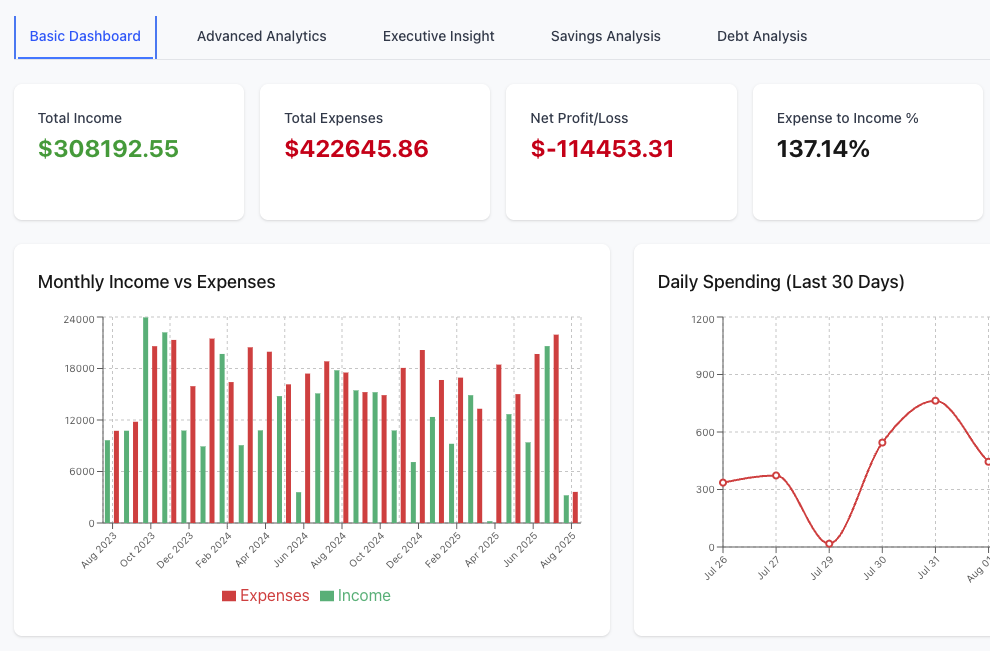
Complete financial overview at a glance
Track income, expenses, and spending patterns with intuitive charts and real-time data.
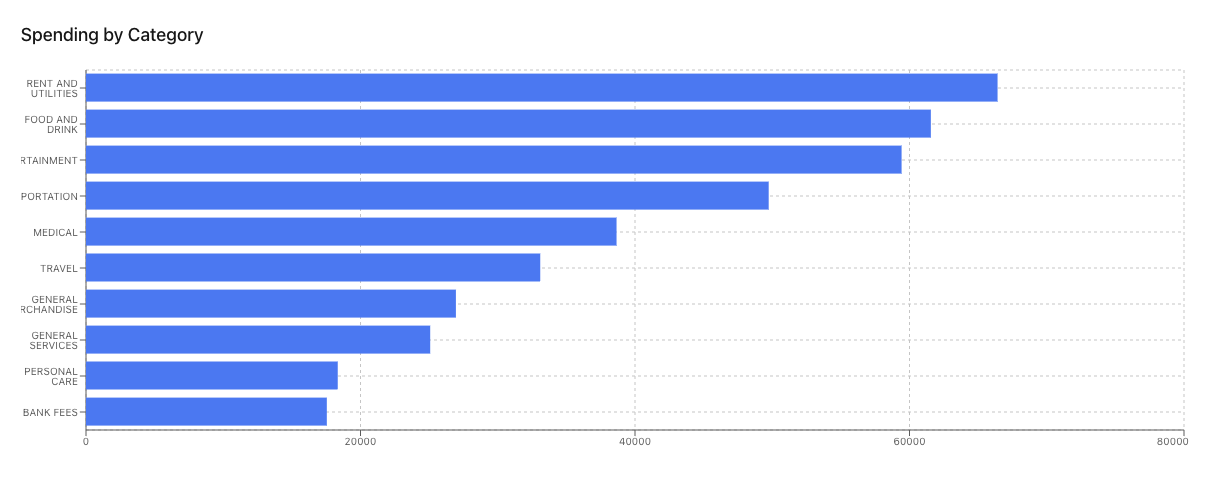
Category Analysis
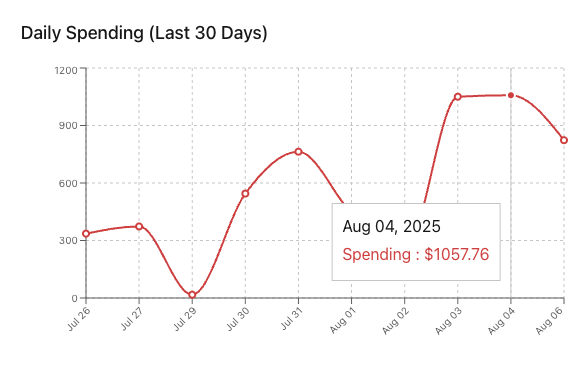
Spending Trends
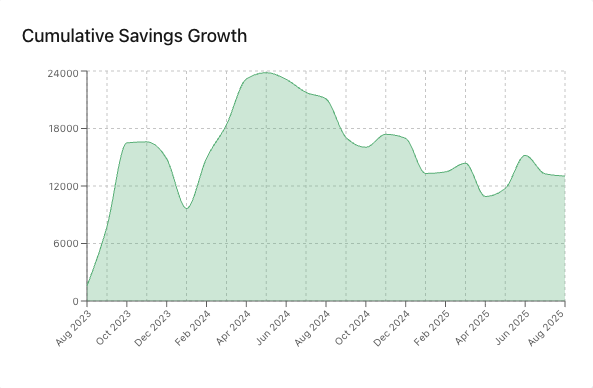
Savings Growth
Five specialized dashboard views
Each dashboard is purpose-built for different analysis needs, from basic overviews to advanced insights.
Basic Dashboard
Essential financial metrics and charts for everyday money management.

- Total income and expenses summary
- Net profit/loss calculations
- Expense-to-income ratio tracking
- Monthly income vs expenses bar chart
- Daily spending trends (last 30 days)
- Spending by category breakdown
- Recent transactions table
- Transaction statistics overview
Advanced Analytics
Deep-dive analytics with enhanced metrics and comprehensive visualizations.
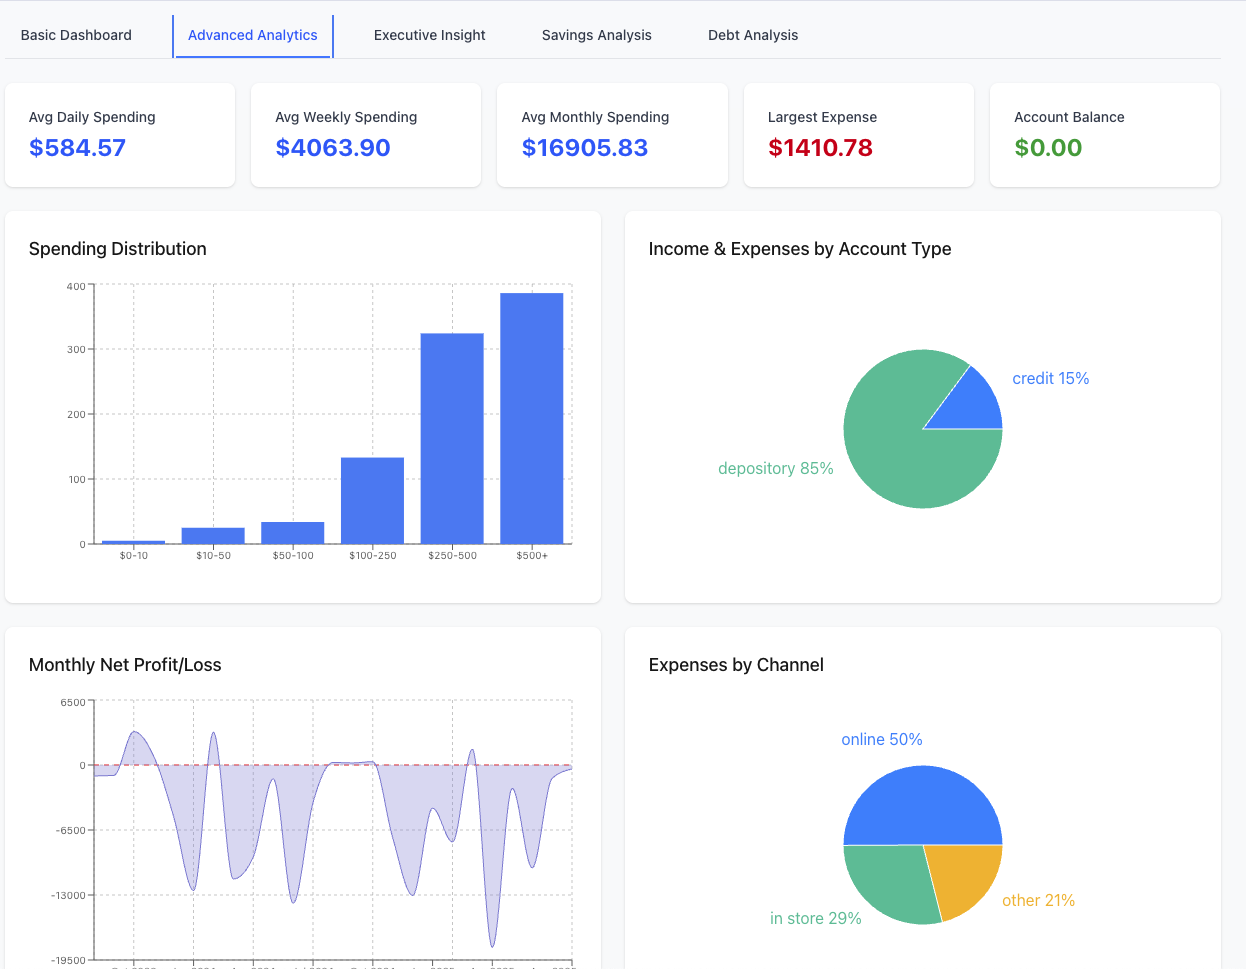
- Average daily, weekly, and monthly spending
- Spending distribution histogram
- Income & expenses by account type
- Monthly net profit/loss area chart
- Expenses breakdown by payment channel
- Day-of-week spending patterns
- Day-of-month spending analysis
- Enhanced time-period calculations
Executive Insights
High-level strategic analysis and key performance indicators for decision making.

- Month-over-month income growth rates
- Quarterly trend analysis
- Income and expense rate of change
- Top 5 income categories analysis
- Cumulative income over time
- Consolidated account summary
- Account balances by type
- Growth rate calculations and projections
Savings Analysis
Comprehensive savings tracking with detailed performance metrics.
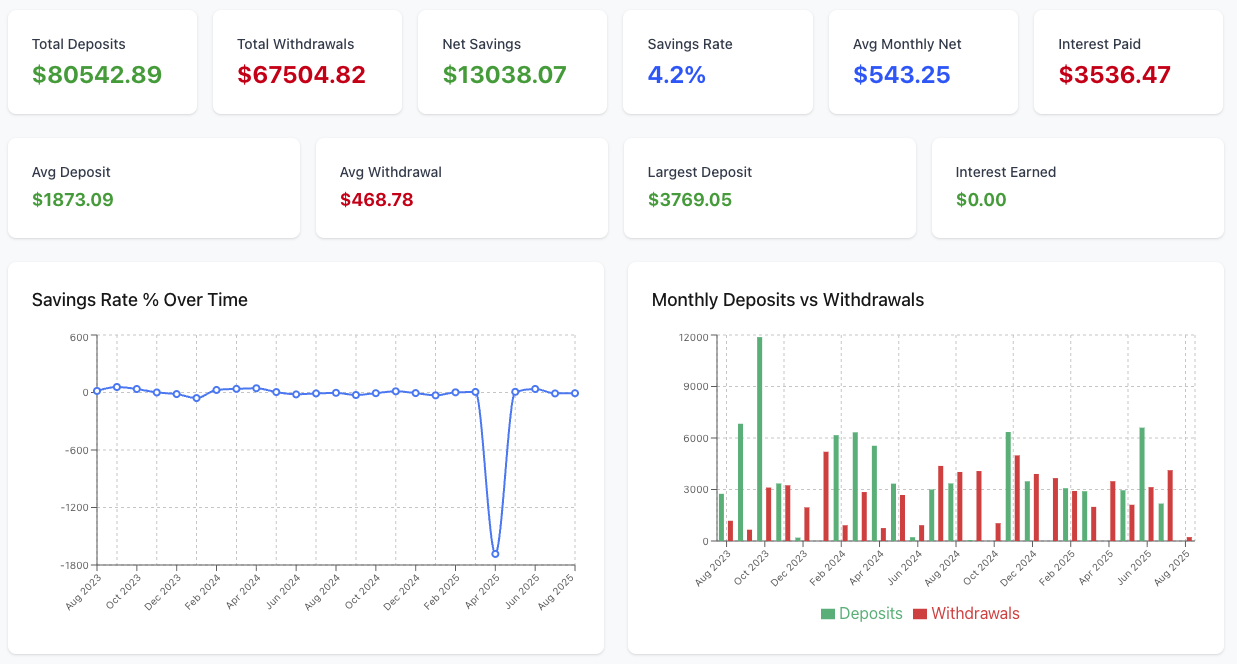
- Total deposits and withdrawals tracking
- Net savings calculations
- Savings rate percentage analysis
- Monthly deposits vs withdrawals charts
- Cumulative savings growth visualization
- Savings by account breakdown
- Transaction frequency by amount
- Interest earned vs fees paid tracking
Debt Management
Credit card and debt tracking with payment behavior analysis.
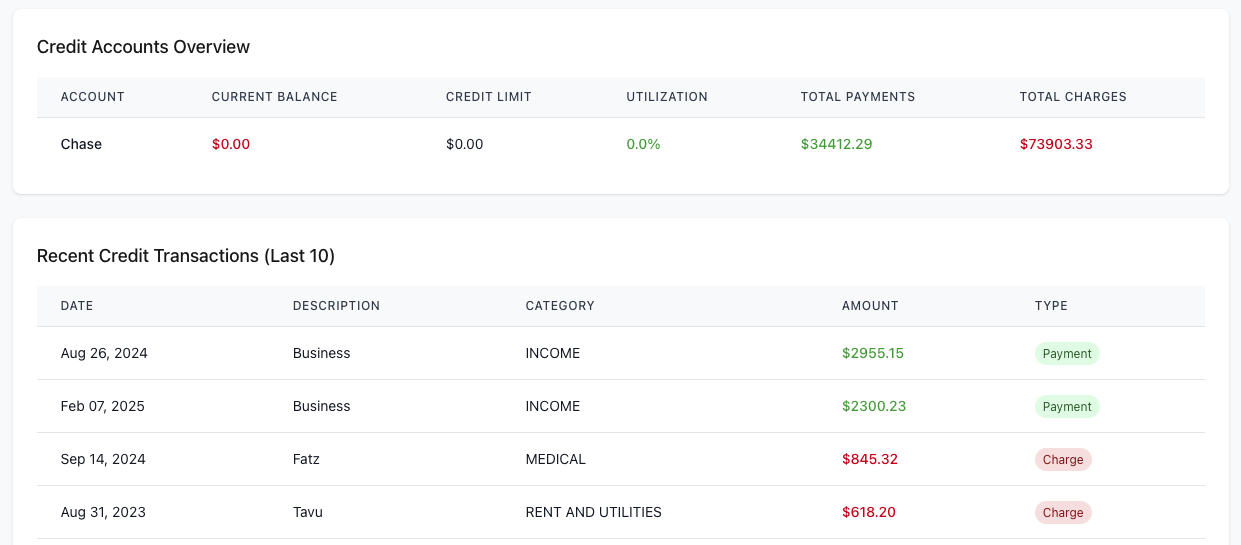
- Total payments vs new charges tracking
- Net debt change calculations
- Credit utilization monitoring
- Interest and fees analysis
- Spending categories on credit
- Cumulative debt change visualization
- Credit accounts overview table
- Payment patterns and frequency analysis
Interactive Recharts visualizations
All charts are built with Recharts library for responsive, interactive data visualization.
Interactive Bar Charts
Monthly comparisons, category breakdowns, and frequency distributions.
Line Chart Analytics
Trend analysis for daily spending, growth rates, and time-series data.
Pie Chart Breakdowns
Account type distributions, savings allocation, and debt by account.
Area Chart Visualizations
Cumulative tracking for savings growth, income, and net profit/loss.
Real-time financial analytics
Your dashboard automatically updates as new transactions sync from your connected accounts.
Advanced Calculations
Growth rates, ratios, and time-based analytics
Trend Analysis
Month-over-month changes and pattern recognition
Interactive Charts
Hover tooltips, responsive design, and detailed breakdowns
Experience comprehensive financial analytics
See all your financial data visualized with interactive charts and detailed breakdowns.